Enhance Your Data With Consumer Demographics
Adding valuable information to your customer files can save your business time and money, and the accuracy
of the enhanced information is critical to your marketing campaign’s success. The
UpdateYourList.com DIY Portal allows you to append demographics to your consumer records in real-time
to get the most out of your contact records. Proprietary match logic provides you the most accurate data
and high match rates to power your marketing campaigns.
Benefits of Consumer Demographics Appends
-
Save time & money with enhanced record information
-
Ensure your customer list is accurate and up-to-date
-
Improve campaign success by better understanding your customers and prospects
-
Reduce the number of inaccurate marketing pieces and telemarketing calls
-
Improve your consumer marketing ROI
Consumer Demographics Data Elements
| Click a demographic category to view each demographic... |
| Family Demos(2) |
| Demographic |
Output/Description |
|
Family: Presence Of Children
|
Y = Yes
Blank = Not Likely To Have Children
|
|
Family: Total Children In Household
|
1 = 1 Child
2 = 2 Children
3 = 3 Children
4 = 4 Children
5 = 5 Children
6 = 6 Children
7 = 7+ Children
|
|
| Financial Demos(3) |
| Demographic |
Output/Description |
|
Financial: Estimated Income
|
A = Under $25K
B = $25K - $49K
C = $50K - $74K
D = $75K - $99K
E = $100K - $149K
F = $150K - $199K
G = $200K - $249K
H = $250K - $299K
I = $300K - $349K
J = $350K - $499K
K = $500K - $999K
L = $1 Million+
|
|
Financial: Median Family Household Income
|
A = Less Than $15K
B = $15K - $19K
C = $20K - $24K
D = $25K - $29K
E = $30K - $34K
F = $35K - $39K
G = $40K - $44K
H = $45K - $49K
I = $50K - $54K
J = $55K - $59K
K = $60K - $69K
L = $70K - $74K
M = $75K - $99K
N = $100K - $124K
O = $125K - $149K
P = $150K - $174K
Q = $175K - $199K
R = $200K+
|
|
Financial: Net Worth
|
A = Under $25K
B = $25K - $34K
C = $35K - $49K
D = $50K - $74K
E = $75K - $99K
F = $100K - $124K
G = $125K - $149K
H = $150K - $199K
I = $200K - $249K
J = $250K - $324K
K = $325K - $499K
L = $500K - $749K
M = $750K - $999K
N = $1 Million+
|
|
| Individual Demos (6) |
| Demographic |
Output/Description |
|
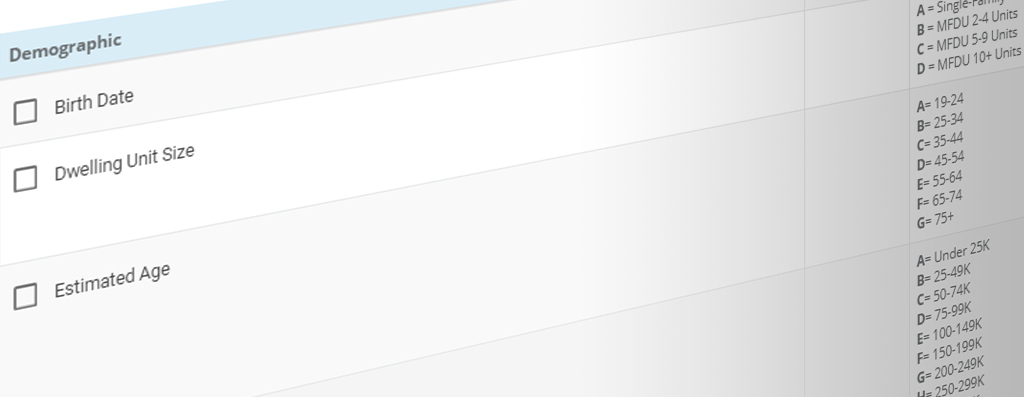
Individual: Birth Date
|
Date Of Birth In YYYYMM Format
|
|
Individual: Estimated Age Range
|
A = 19 - 24
B = 25 - 34
C = 35 - 44
D = 45 - 54
E = 55 - 64
F = 65 - 74
G = 75+
|
|
Individual: Exact Age Range
|
) = 18 - 19
% = 20 - 21
> = 22 - 23
? = 24 - 25
# = 26 - 27
@ = 28 - 29
A = 30 - 31
B = 32 - 33
C = 34 - 35
D = 36 - 37
E = 38 - 39
F = 40 - 41
G = 42 - 43
H = 44 - 45
I = 46 - 47
J = 48 - 49
K = 50 - 51
L = 52 - 53
M = 54 - 55
N = 56 - 57
O = 58 - 59
P = 60 - 61
Q = 62 - 63
R = 64 - 65
S = 66 - 67
T = 68 - 69
U = 70 - 71
V = 72 - 73
W = 74 - 75
X = 76 - 77
Y = 78 - 79
Z = 80 - 81
1 = 82 - 83
2 = 84 - 85
3 = 86 - 87
4 = 88 - 89
5 = 90 - 91
6 = 92 - 93
7 = 94 - 95
8 = 96 - 97
9 = 98+
|
|
Individual: Household Composition
|
A = 1 Female
B = 1 Male
C = 1 Male & 1 Female
D = 1 Male, Female & Children
E = 1 Female & Children
F = 1 Male & Children
G = 1 Adult
H = 1 Adult & Children
I = 1 Male & 1 Other Adult
J = 1 Male, Other Adult & Children
K = 1 Female & 1 Other Adult
L = 1 Female, Other Adult & Children
M = 2 Adults
N = 2 Adults & Children
|
|
Individual: Marital Status
|
A = Married
B = Single
|
|
Individual: Median Years In School
|
A = Less Than 12
B = 12
C = 13 - 15
D = 16
E = 17+
|
|
| Mail Order Demos (1) |
| Demographic |
Output/Description |
|
Mail Order: Mail Order Responder
|
A = Yes
Blank = Unknown
|
|
| Occupation Demos(1) |
| Geography |
Output/Description |
|
Occupation: Occupation Type
|
A = Homemaker/Retired/Student
B = Blue Collar
C = White Collar
D = Professional
|
|
| Property Demos (8) |
| Demographic |
Output/Description |
|
Property: Dwelling Unit Size
|
A = Single-Family Dwelling Unit
B = Multi-Family 2 - 4 Units
C = Multi-Family 5 - 9 Units
D = Multi-Family 10+ Units
|
|
Property: Estimated Home Value
|
A = Under $25K
B = $25K - $49K
C = $50K - $74K
D = $75K - $99K
E = $100K - $149K
F = $150K - $199K
G = $200K - $249K
H = $250K - $299K
I = $300K - $349K
J = $350K - $499K
K = $500K - $999K
L = $1 Million+
|
|
Property: Hispanic Neighborhood
|
Y = Neighborhood Is 80% Or More Hispanic
|
|
Property: Home Owner Type
|
A = Home Owner
B = Renter
C = Probable Renter
D = Probable Home Owner
|
|
Property: Home Property Indicator
|
A = Residential
B = Condominium
C = Suite
D = Apartment
G = Mobile Home
|
|
Property: Length Of Residency
|
A = 0 Years
B = 1 Year
C = 2 Years
D = 3 Years
E = 4 Years
F = 5 Years
G = 6 Years
H = 7 Years
I = 8 Years
J = 9 Years
K = 10 Years
L = 11 - 14 Years
M = 15+ Years
|
|
Property: Median Home Value
|
A = Less Than $25K
B = $25K - $49K
C = $50K - $74K
D = $75K - $99K
E = $100K - $149K
F = $150K - $199K
G = $200K - $249K
H = $250K - $299K
I = $300K - $349K
J = $350K - $499K
K = $500K+
|
|
Property: Multi-Family Dwelling Unit
|
Y = Yes
Blank = Unknown
|
|
Related Consumer Demographics Services
Append consumer demographics when using the following services to enhance your customer list even more...
This Consumer Demographics landing page content was last updated on: 7/20/2018